As we start the year in the block we are focusing on Statistics. We are looking at data about everything from the fruits we like to the different colours of M&Ms in a small packet.
Here are some of the thing we have learnt so far.
Samson
I asked people what is your favourite fruit and made tally chart and bar graph.
Oi’Oi
We did statistics with M&Ms.

Welcome to our class blog, We are Room 23. We are a year 3/4 at Pt England School learning with Ipads.
Showing posts with label Statistics. Show all posts
Showing posts with label Statistics. Show all posts
Tuesday, 18 February 2020

Saturday, 11 February 2017
Fun with Statistics
On Friday room 14 took part in a statistical investigation to find out what colours are most and least common in a small bag of M&Ms. Each member of the class had a small bag of M&Ms which they opened counted and displayed the colours in the packet as a bar graph.


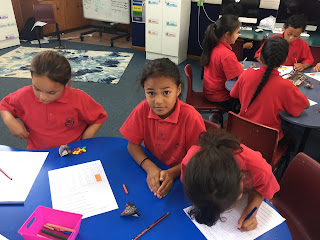


We found out which colour was least common in your packet.

We found out which colour was most common in our packet.
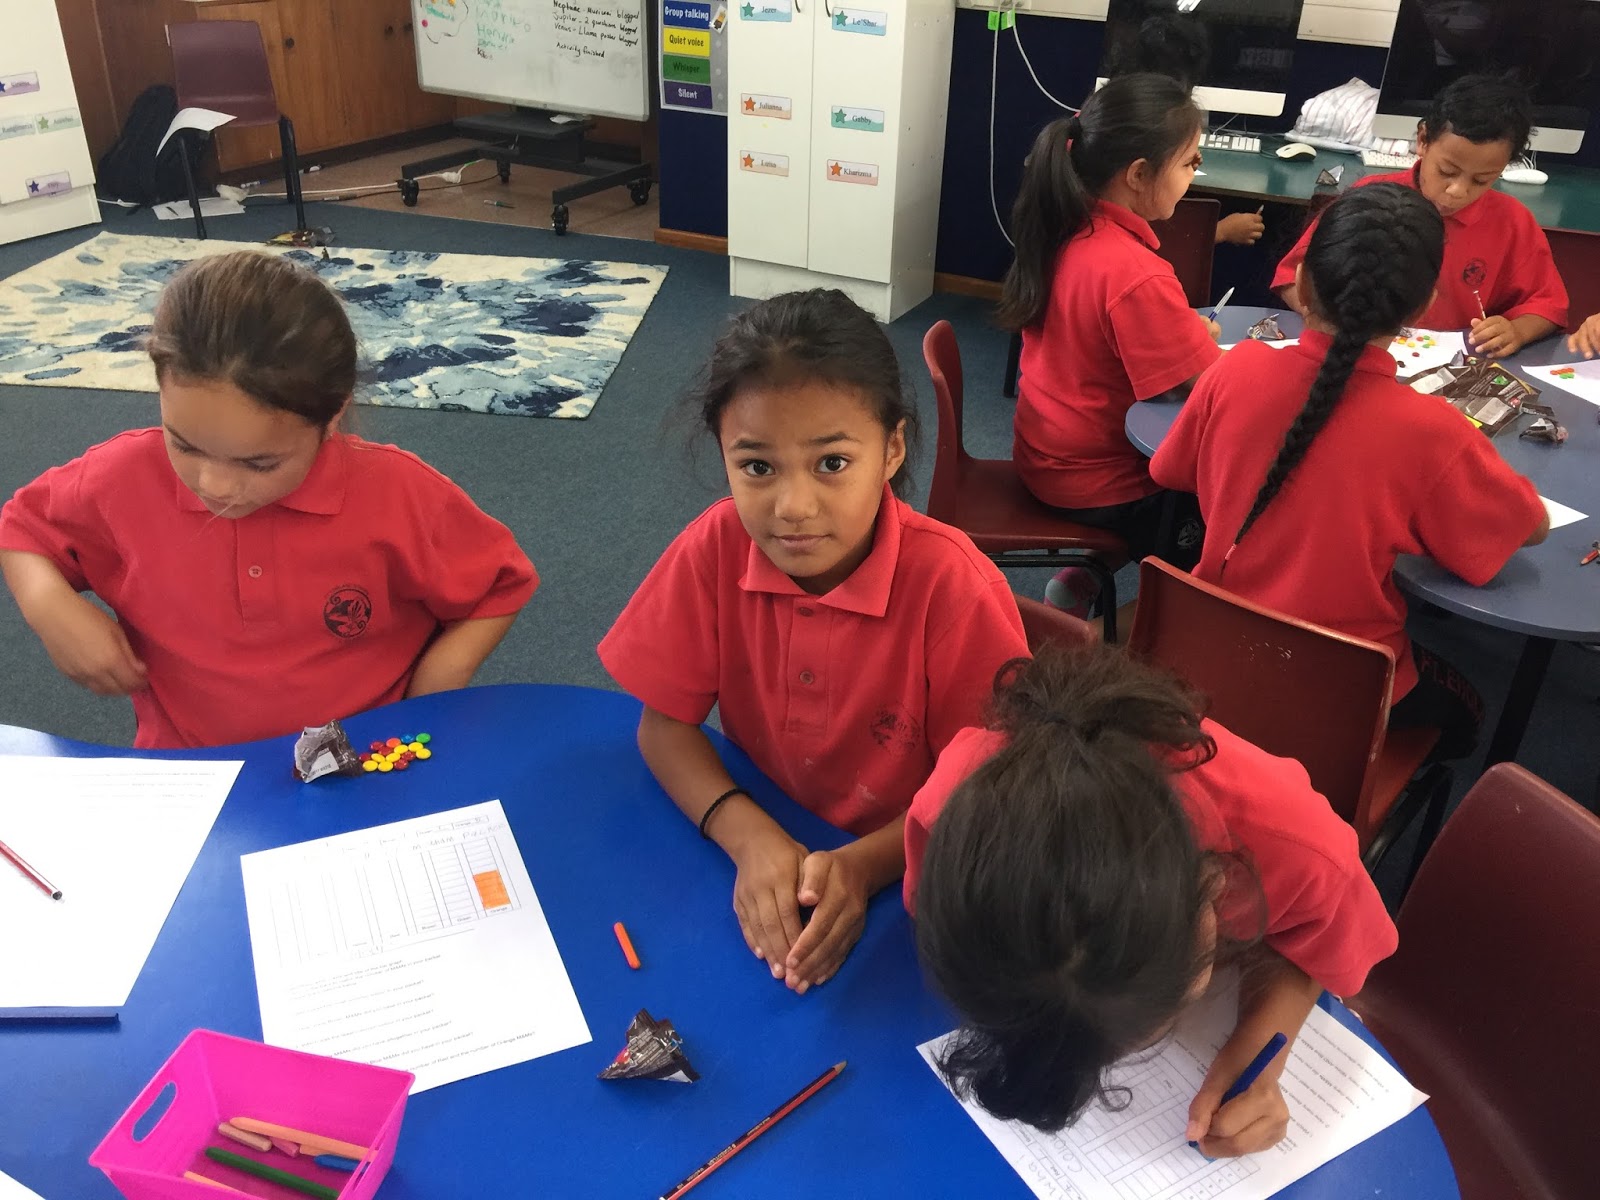
We enjoyed working out the difference between the colours.
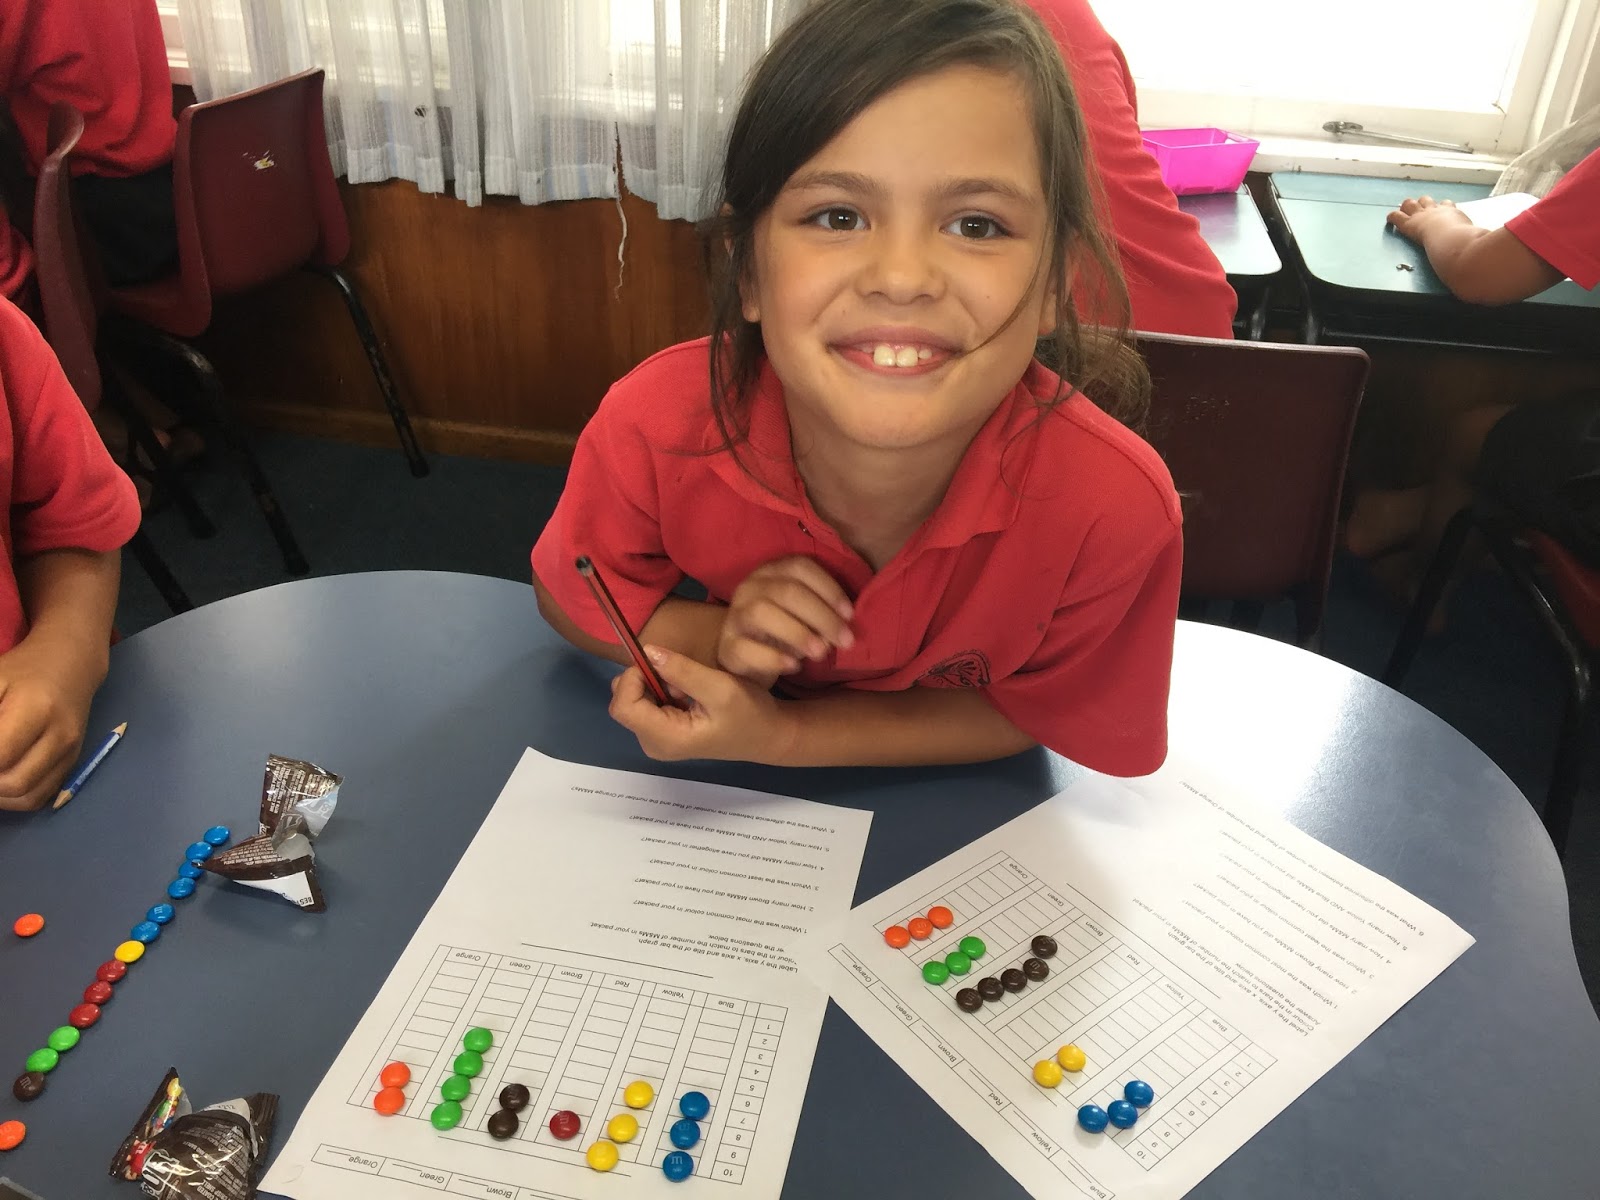
We learnt that no all our packets had the same colours.
Subscribe to:
Posts (Atom)